It's the last day before our two-week winter break, and I can safely say that most of us teachers are as excited as the students! I finished my 150 math notebooks, regraded the latest quiz, and now have the computer uploads to do for quarterly and semester grades and citizenship marks. I can do this with half of my brain tied behind my back. Good thing, too, because I think that's about all I have left!
Today is going to be a modified dress code day, the dance after school, and supervision of the tutorial group until 5:00. Good thing I've got a low key day with my sixth graders!
We're doing some coordinate graphing of a "mystery picture" (ssshhh, don't tell - it's Santa Claus). We're going to do a little mental math game called Albert's Insomnia. No heavy lifting in the brain area today!
It's been a great first semester. I'm not in line with the district's pacing calendar - I'm swimming as fast as my little guppies can travel....but we have made great strides with our skills. I'm especially proud of my students who are embracing problem-solving a little bit more and a little bit deeper. I am so happy that I hear comments floating to my ears like these: "Math class went fast today!" "I want to re-do an assignment." I love the big ear-to-ear smiles when a student sees how well they are doing on their assessments. I am enjoying the Wall of Champions filled with colorful post-it notes that indicate a student had 80% or better on an assessment. (Thanks for the idea, Daniel!)
2013 has been very, very good for the math teacher....Merry Christmas and Happy New Year to you all! It's a two-week break from blogging (perhaps...) but not from thinking about what comes next!
Four days til a two-week winter break, and teachers everywhere are asking..."How am I going to make it through this week?" I must admit, I am looking forward to two weeks off as well, but I am enjoying teaching so much right now, I can't wait to work with my students this week with some holiday themed problem-solving! I need that perfect combination of engagement, learning, and thinking to make this week enjoyable for us all. Soda Santa to the rescue today.
Yummy Math comes through for me with this estimation activity. Soda Santa is a display of carbonated beverage products at your local grocery store. You may have walked past him or one of the companion displays and not even realized it. While at my Safeway yesterday, I saw the Christmas tree design. Normally, I wouldn't even given it a thought, but I was in my teacher-noticing mode. I refrained from having my friend take my picture next to it.
Yummy Math has some great suggestions for using this display for estimation, multiplication practice, and some algebraic thinking. I wonder if we could get some geometry in there too....How many square feet of store space is required for this display? What does Safeway charge the bottling company for this prime piece of real estate for advertising? How long does it take to put up this display? I'd like to translate this 3-D display onto paper on a grid and make a coordinate activity.
Is it math mania....or just too much caffeine this morning?
It's been an interesting few weeks in the Old Pueblo (Tucson's nickname). We've officially moved from summer to winter. Thanksgiving break is over....the winter break is looming ahead (and not getting here fast enough for some!) My students are currently working on proportional reasoning. We've have been using some of the best resources I know out there.
MATH SNACKS - Great web site from New Mexico State University with short videos and games to reinforce several math skills. It is a developing site with materials for students and teachers. I've used the Bad Date video that introduces the idea of ratios and Ratey the Math Cat who is an odd character that notices rates with the word PER....(purrrrr....get it?). We also used the sheet for making a rate table and then a graph of the data. Good stuff!
One of my accelerated classes then tackled a group project yesterday from Yummy Math called Done with the Leaves...now for the Snow. This investigation looks at proportional reasoning in another way - if the number of workers increases, how long does it take to do a given number of hours of work? This time I asked partners to make their own table and graph to model the data in the problem. Student understanding and products varied - some students wanted to divide all of the numbers by 2. It took some questioning to get them to understand that this was not the case. Some students made their scales for the graph with only the numbers in the data table instead of a scale with equal intervals. This created a linear graph instead of a curved graph. A few groups finished their graphs and are now tackling the questions, "How is this graph different from the others we just did? Why is it different?" We'll tackle the snow portion next week.
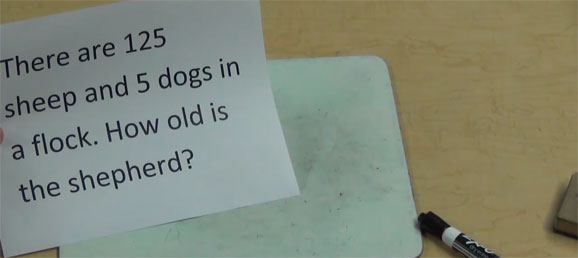
You may have read my post about Robert Kaplinsky and his lessons. He also has a blog which I read. This week's gem was about his experience in asking the following question of some eighth grade students:
You may be interested in seeing the video of his work with some students to see their responses. I couldn't wait to try this out with my students and see what my sixth graders would say. I didn't interview them individually, but I asked them as a class to write their answer on paper. I made sure I didn't say "answer the question" or "figure it out". I just said, "Write your answer." The results were very similar to Robert's - 12% of my five classes of students responded appropriately and 88% responded with a numerical answer. It was interesting to see their faces when they read the prompt. So many looked quizzical or amused, but so many STILL used the numbers to calculate an age. So, I said, if I bring a bunch of sheep and a few dogs into the classroom, you can tell me how old I am? LOL
Why did they do these calculations?
We had a discussion each period in order to understand better how this happens. Some students thought it was a trick. Others stated that I expected an answer. We talked about how one of the first things we need to do when a problem is posed is to make sure we UNDERSTAND what is being asked and look at the data provided. We have to decide what information is unnecessary and what information may be needed (how many inches in a foot, for example). Jumping into a calculation is not always the BEST way to proceed.
Most of the time, students don't take enough time to reflect in this manner - their objective is to identify the numbers, use clues as to determine the operation, find the answer....be FINISHED! Any number will do. Check my work? Decide if it is reasonable? Nah.
How do we help students to do this on their own? I took this one step further in several of the classes after my "a-ha" moment. What if I hide the question and ask students to brainstorm possible questions that could be answered with the given data? The students could generate some very good questions including ratios much to my delight! What I also noticed is that students love to generate questions that cannot be answered: How many sheep does each dog supervise? Students use their imaginations to include details into the scenario that are called "assumptions" that are not valid. I believe this is lack of skill in understanding how logical arguments work. They are 11 and 12 after all.
It's been a good week for opening up my thinking as a teacher and their thinking as learners. We've been exploring Math Munch as independent study and using BuzzMath for independent practice for my intervention students. I'm so grateful for the contributions of all these talented math teachers and mathematicians. Thanks for expanding the ratio of teaching and learning in our classroom!